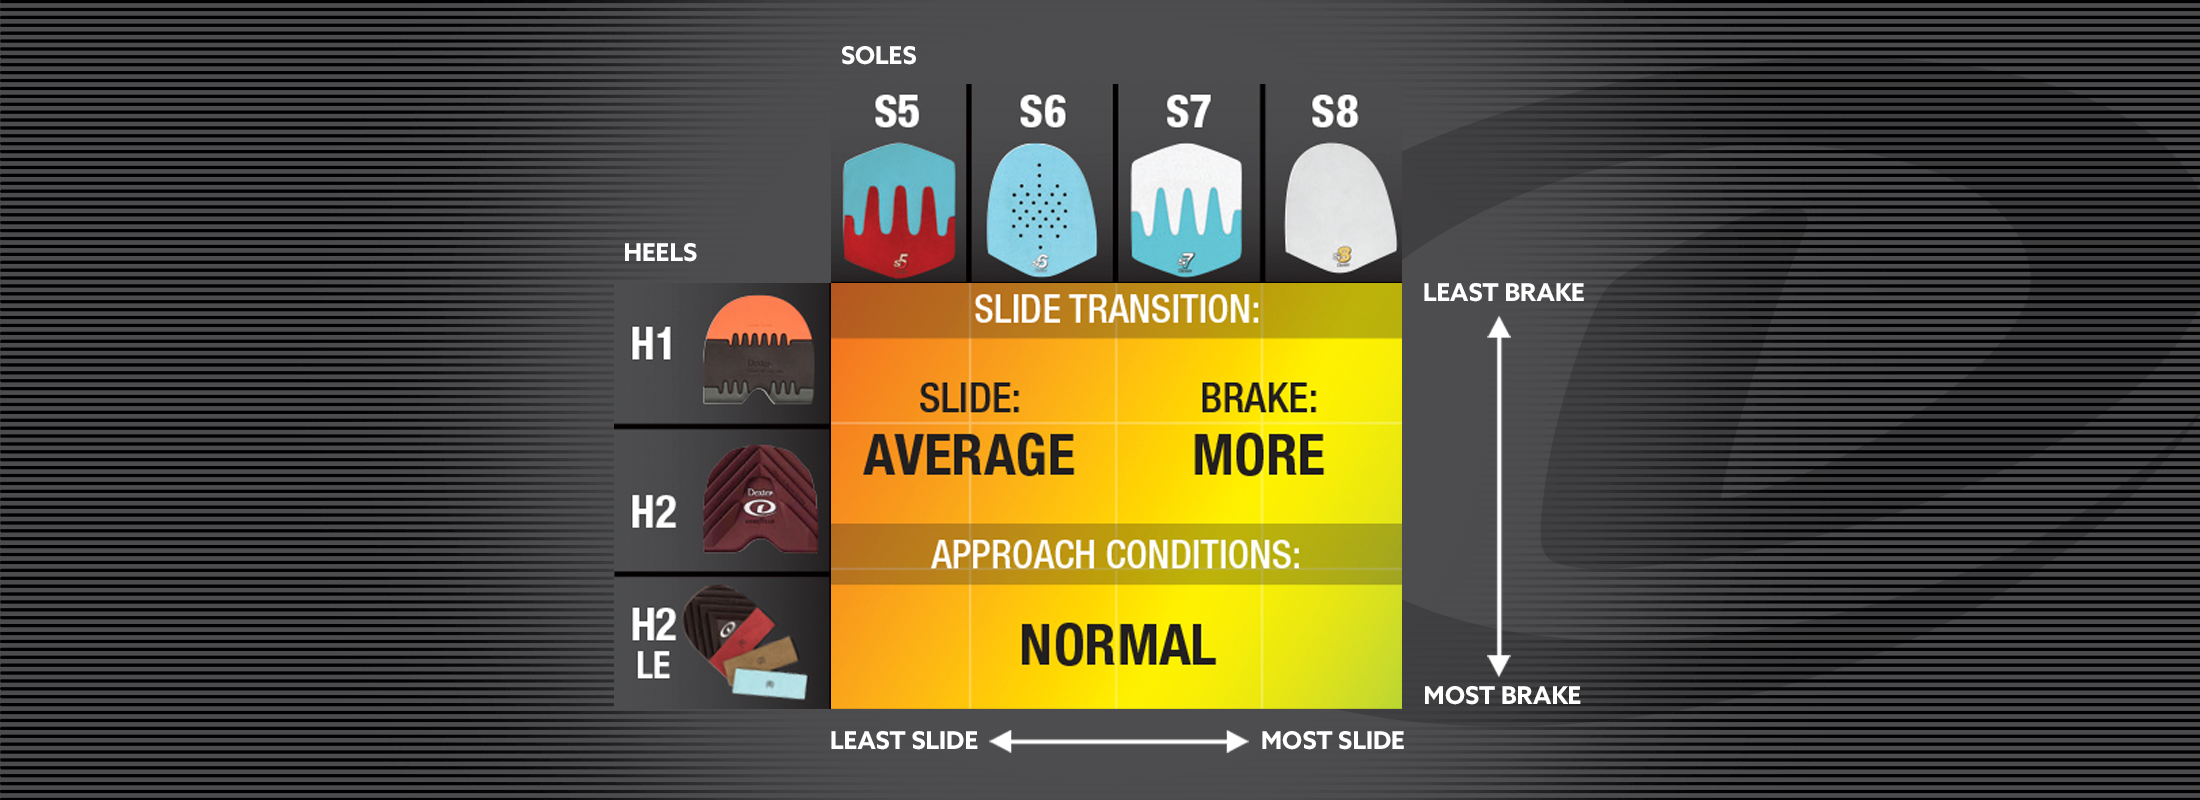
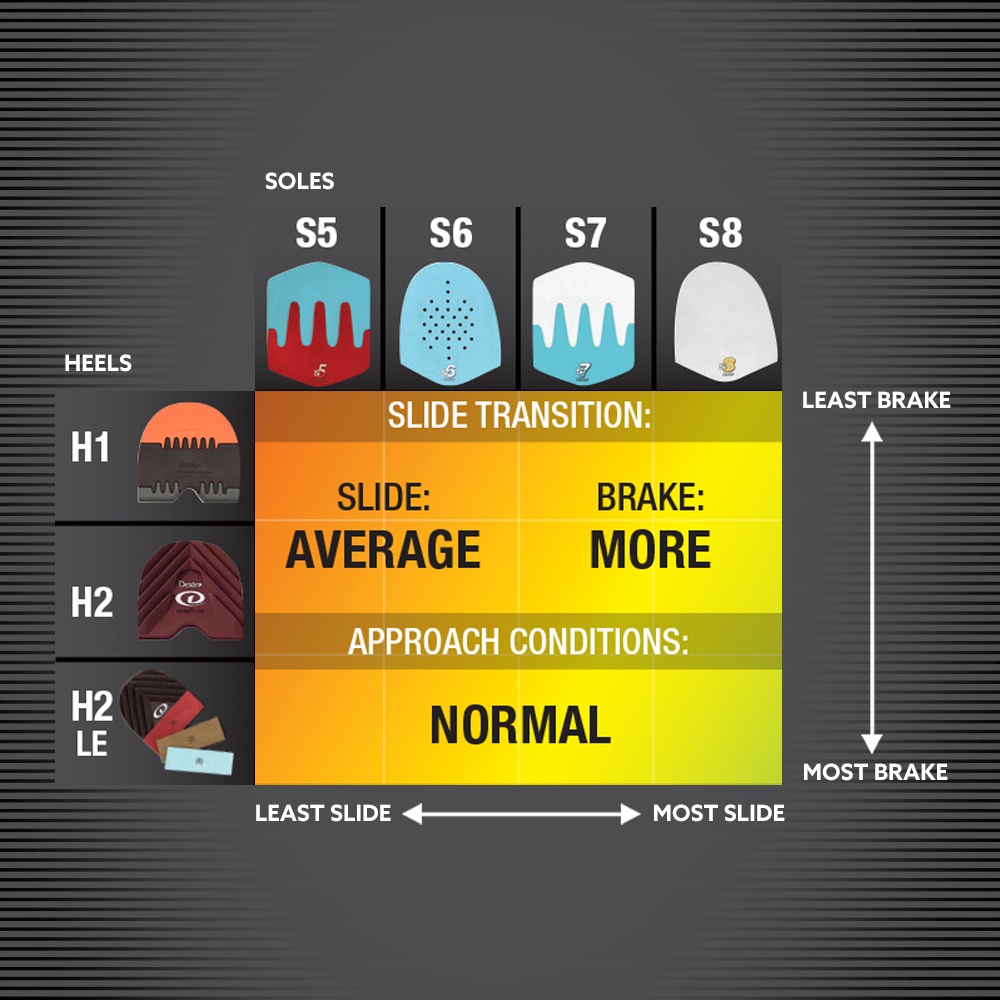
A grid chart comparing various shoe soles and heel designs based on their slide and braking performance. The vertical axis lists three types of heels (H1, H2, and H2 LE), while the horizontal axis lists four types of soles (S5, S6, S7, and S8) ranging from lower slide to higher slide. The chart indicates that the combination of these soles and heels results in an average slide with more brake, making it ideal for normal approach conditions. The background color transitions from yellow to orange, reflecting the change from least slide and least brake to most slide and most brake. This chart is helpful for identifying combinations that deliver a balanced slide with strong braking under versatile conditions. A grid chart comparing various shoe soles and heel designs based on their slide and braking performance. The vertical axis lists three types of heels (H1, H2, and H2 LE), while the horizontal axis lists four types of soles (S5, S6, S7, and S8) ranging from lower slide to higher slide. The chart indicates that the combination of these soles and heels results in an average slide with more brake, making it ideal for normal approach conditions. The background color transitions from yellow to orange, reflecting the change from least slide and least brake to most slide and most brake. This chart is helpful for identifying combinations that deliver a balanced slide with strong braking under versatile conditions.

Normal Approach with More Braking

Upgrade your game with soles and heels tailored for a standard approach and increased braking.

11 Results: found

  • Blue/Red (Multicolor)
  • White/Blue (Multicolor)
  • Blue/Red (Multicolor)
  • Blue/Red (Multicolor)
  • Brown (Multicolor)
  • White/Blue (Multicolor)
  • White/Blue (Multicolor)