Bowling ball with bowling pins in the background. Bowling ball with bowling pins in the background.

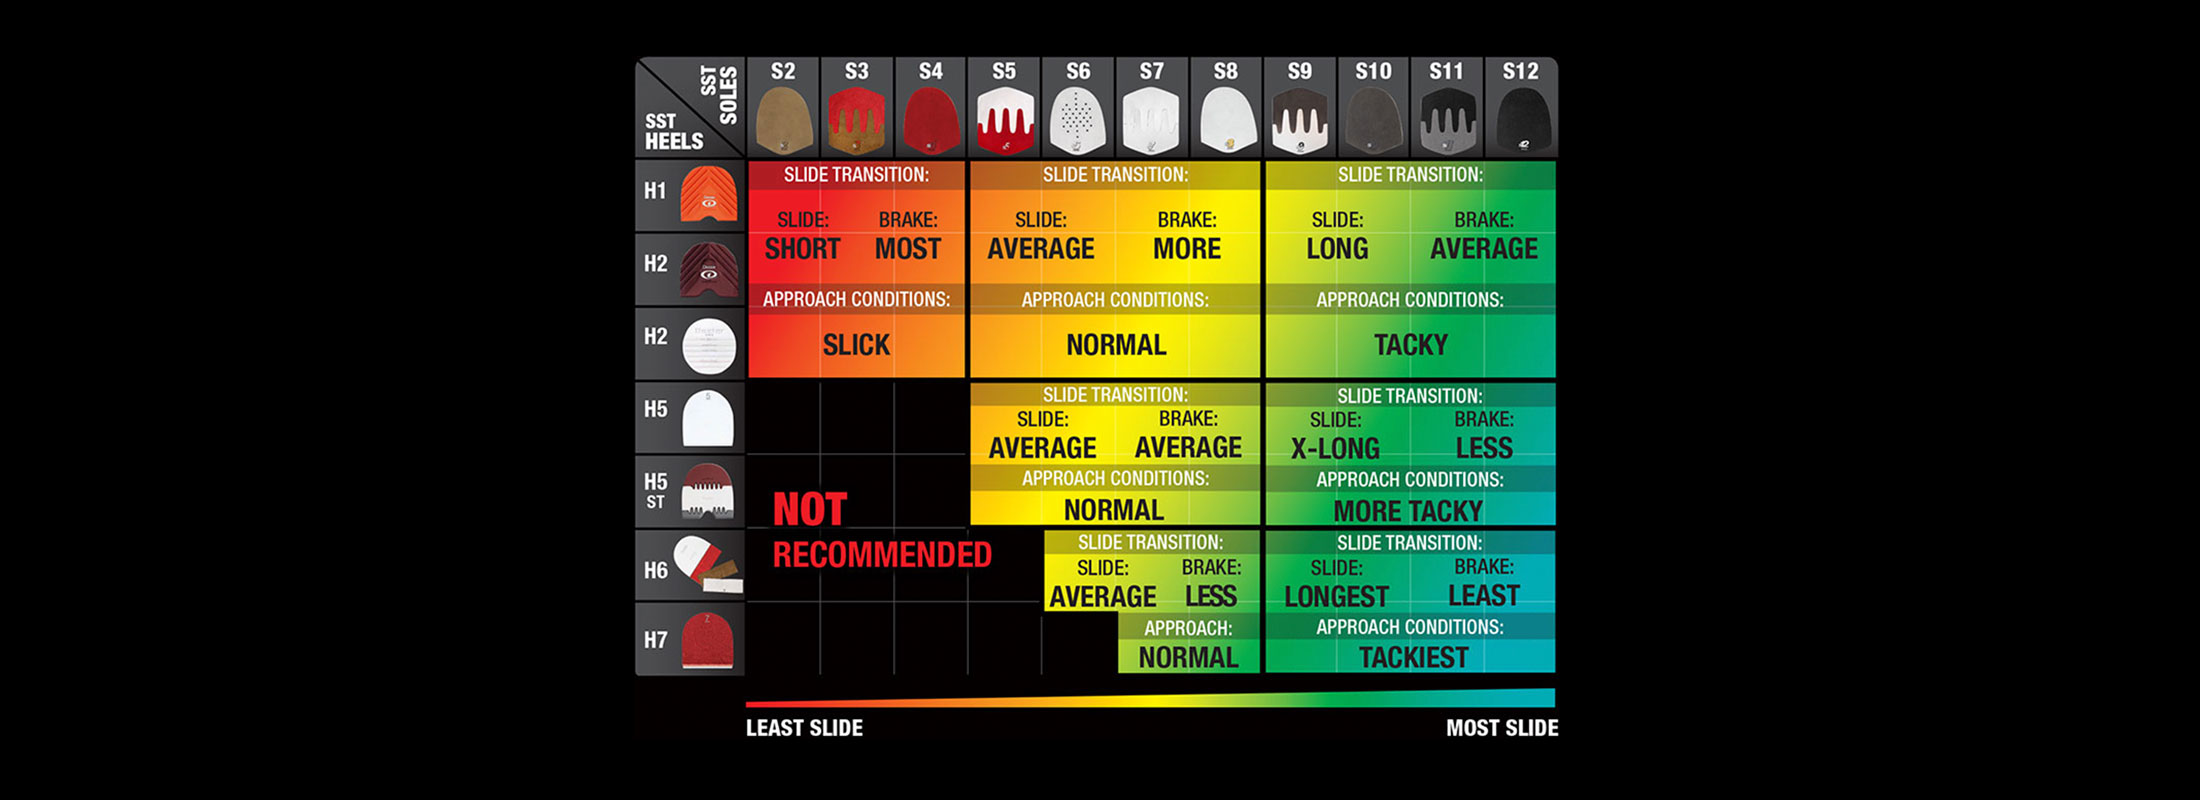
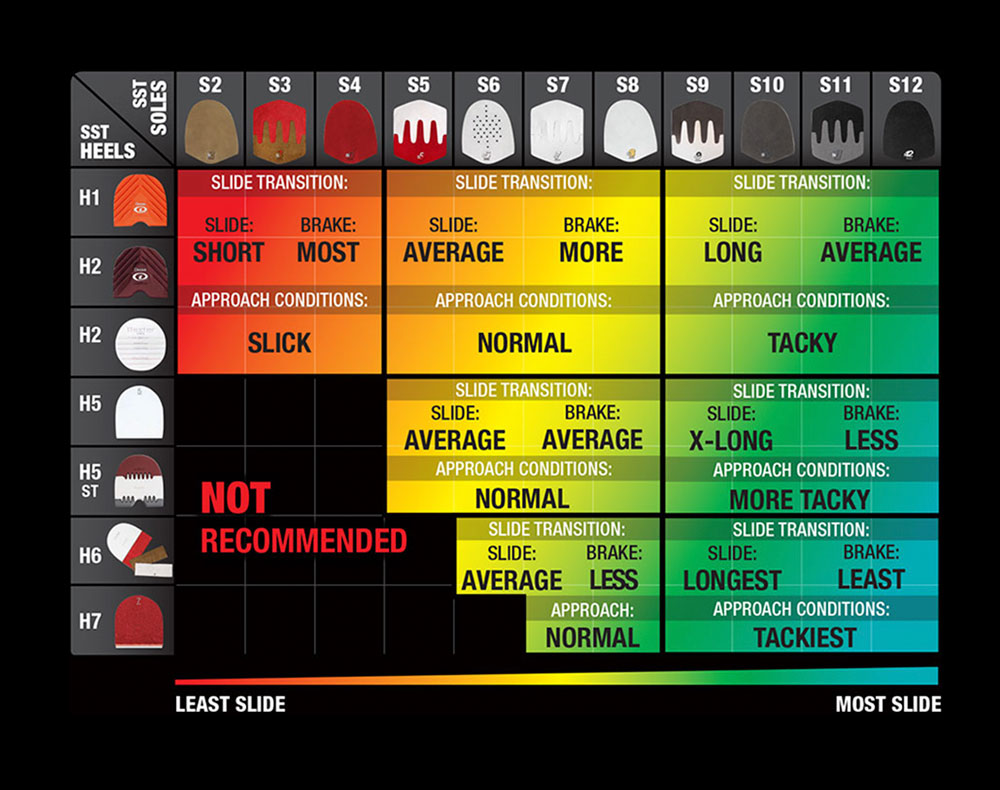
Need Help Selecting The Right Sole And Heel Combination For Your Game?

Our soles and heels selector makes it easy to find your ideal solution in seconds

Find Yours Here

Soles and Heels

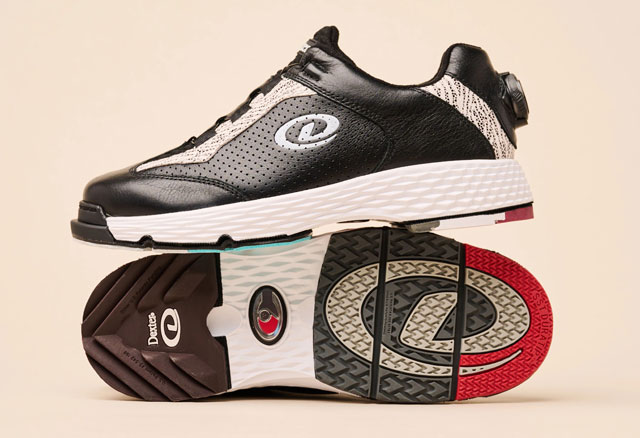
Step onto the lanes with confidence wearing our high-quality bowling soles and heels, designed for enhanced performance and comfort.

44 Results: found

  • Orange/White (Multicolor)
  • Brown/White (Multicolor)
  • White (Multicolor)
  • Red/Brown (Multicolor)
  • Blue/Red (Multicolor)
  • Black/Grey (Multicolor)
  • White/Blue (Multicolor)
  • Brown/White (Multicolor)
  • White (Multicolor)
  • Grey/Red (Multicolor)
  • Brown/White (Multicolor)
  • Red/Brown (Multicolor)
  • Blue/Red (Multicolor)
The image is a more detailed grid chart comparing various types of shoe soles and heel designs in terms of their slide and braking performance. The chart features two main axes: Vertical Axis (Y-Axis): Lists different types of heels from H1 through H7. Horizontal Axis (X-Axis): Lists different types of soles from S2 through S12, ranging from low to high sliding capabilities. Key Details: Heels (Left Column): Includes several heel types (H1, H2, H5, H5 ST, H6, and H7) with each row indicating the recommended sole pairing. Soles (Top Row): Includes soles S2 through S12, showing how they pair with different heels for varying slide and brake characteristics. Slide and Brake Transitions: Slide Transition (Color Coded): The slide behavior ranges from short to long with some entries indicating “not recommended” in red. Brake Strength: Color-coded from red (most brake) to green (least brake). Approach Conditions: The chart also indicates the types of approach conditions each combination is best suited for, ranging from slick to tacky. Slide and Brake Performance: The chart has a gradient background that transitions from red on the left (least slide, most brake) to green on the right (most slide, least brake). The lower-left corner (H5 ST, H6) indicates combinations that are “not recommended.” The right side with higher numbers (S9 to S12) and heels H1 to H5 indicates long to extra-long slides with less brake, suited for tacky to more tacky conditions. This chart provides a detailed guide for selecting soles and heels based on sliding and braking preferences and surface conditions. The image is a more detailed grid chart comparing various types of shoe soles and heel designs in terms of their slide and braking performance. The chart features two main axes: Vertical Axis (Y-Axis): Lists different types of heels from H1 through H7. Horizontal Axis (X-Axis): Lists different types of soles from S2 through S12, ranging from low to high sliding capabilities. Key Details: Heels (Left Column): Includes several heel types (H1, H2, H5, H5 ST, H6, and H7) with each row indicating the recommended sole pairing. Soles (Top Row): Includes soles S2 through S12, showing how they pair with different heels for varying slide and brake characteristics. Slide and Brake Transitions: Slide Transition (Color Coded): The slide behavior ranges from short to long with some entries indicating “not recommended” in red. Brake Strength: Color-coded from red (most brake) to green (least brake). Approach Conditions: The chart also indicates the types of approach conditions each combination is best suited for, ranging from slick to tacky. Slide and Brake Performance: The chart has a gradient background that transitions from red on the left (least slide, most brake) to green on the right (most slide, least brake). The lower-left corner (H5 ST, H6) indicates combinations that are “not recommended.” The right side with higher numbers (S9 to S12) and heels H1 to H5 indicates long to extra-long slides with less brake, suited for tacky to more tacky conditions. This chart provides a detailed guide for selecting soles and heels based on sliding and braking preferences and surface conditions.